
.png)

What Is a Cash Flow Forecast?
A cash flow forecast is a projection of the money flowing into and out of your business over a specific period. It tells you whether you will have enough cash on hand to cover your obligations, and it gives you the lead time to act before a shortage becomes a crisis. Unlike a profit and loss statement, which shows whether your business is profitable on paper, a cash flow forecast shows the actual cash available in your bank account at any given point.
This guide covers the essential components of a cash flow forecast, how to calculate your cash runway, how to track cash flow on a weekly basis, and the most common mistakes that derail otherwise solid financial planning.
Essential Components Every Business Owner Should Know
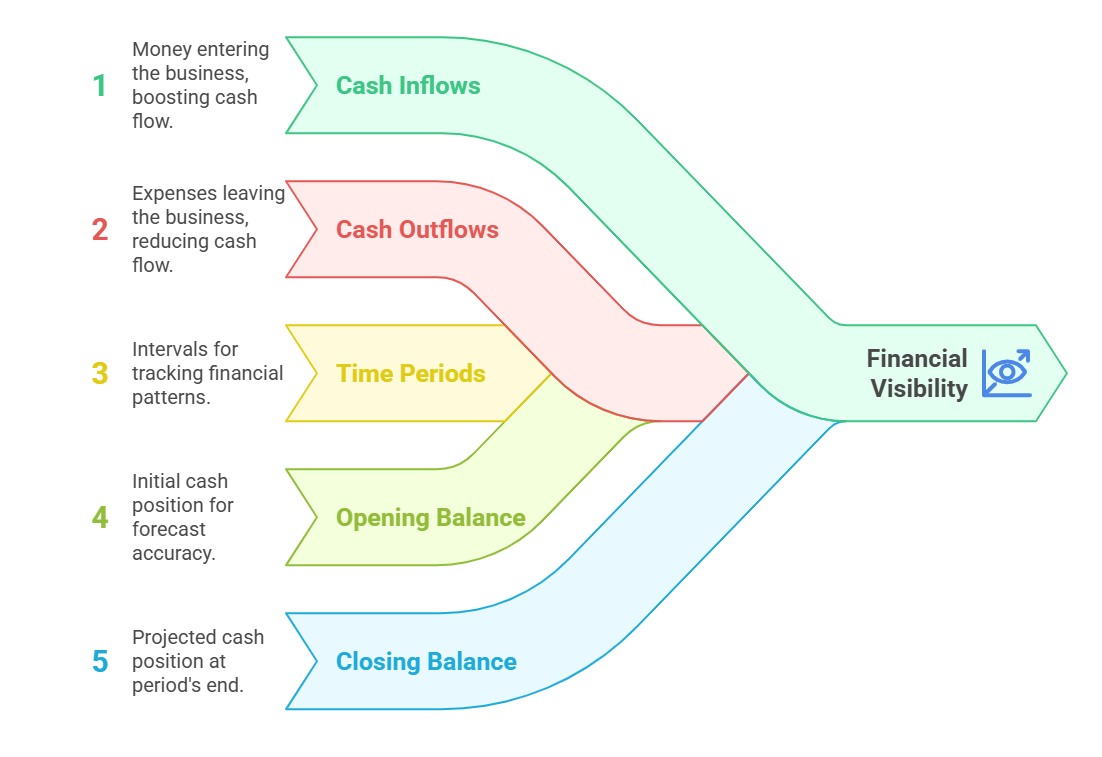
Every cash flow forecast is built from five core elements:
Cash inflows. All money coming into your business, including sales revenue, customer payments, and any other income sources.
Cash outflows. Every expense leaving your business, from rent and payroll to inventory purchases and loan repayments.
Time periods. The intervals you are forecasting, typically weekly, monthly, or on a rolling 13-week basis. Shorter periods give you more precision; longer periods give you more strategic visibility.
Opening balance. Your cash position at the start of each forecast period.
Closing balance. Your projected cash position at the end of each period, which becomes the opening balance for the next one.
How to Calculate Your Cash Flow Runway
Cash runway tells you how many months your business can operate before depleting its available cash, based on your current spending rate. It is one of the most important numbers a business owner can know, because it tells you exactly how much time you have to fix a problem or raise capital before reaching zero.
The formula:
Cash Runway = Available Cash ÷ Monthly Burn Rate
Calculating your monthly burn rate. Burn rate is the net amount of cash your business consumes each month. Add up total monthly expenses, including payroll, rent, utilities, and variable costs like inventory. Then subtract monthly revenue. The result is your net burn. Because burn rate fluctuates month to month, average it over three to six months for a more reliable baseline.
Calculating available cash. This is not just your bank balance. Include checking and savings balances, readily accessible investments, and accounts receivable you expect to collect within 30 to 60 days. Subtract any restricted funds or committed obligations. Be conservative. It is better to underestimate your runway than to discover mid-crisis that funds you counted on were not actually accessible.
Example: A business has $90,000 in available cash and a monthly net burn rate of $15,000. Cash runway = $90,000 ÷ $15,000 = 6 months.
Many businesses review runway monthly and update the underlying forecast quarterly, which keeps the number accurate as conditions change.
Revenue Prediction Strategies That Work
Accurate revenue prediction is the backbone of a reliable forecast.
Historical analysis. Review at least 24 to 36 months of revenue data to identify trends, seasonal patterns, and growth rates that are likely to continue.
Customer payment patterns. Track how long customers typically take to pay invoices. This tells you when revenue will actually hit your account, not just when a sale occurs.
Pipeline assessment. For businesses with a sales pipeline, assign realistic probability percentages to pending deals rather than counting them as guaranteed revenue.
Conservative estimates. Build in a buffer by slightly underestimating income. Overoptimistic projections are one of the most common causes of cash flow surprises.
Expense Timing: Why When Matters as Much as How Much
Knowing your total expenses is only half the picture. Knowing exactly when those expenses hit your account is what makes a forecast useful.
Map fixed expenses precisely. List recurring costs like rent, insurance, and subscriptions with their exact due dates.
Track variable costs separately. Materials, shipping, and commission payments fluctuate with business activity and need their own tracking line.
Account for seasonal adjustments. Marketing spend often increases during peak seasons. Maintenance costs often rise during slow periods. Build these patterns into your forecast rather than treating them as surprises.
Build in contingency reserves. A buffer for unexpected expenses prevents a single unplanned cost from derailing your entire forecast.
Weekly Cash Flow Tracking for Tighter Control
Monthly forecasting gives you strategic visibility. Weekly tracking gives you the precision to catch problems before they become urgent. This level of detail is especially valuable for businesses managing tight margins or daily repayment obligations.
Key metrics to track weekly:
Days Sales Outstanding (DSO) measures how quickly you collect payments from customers. A lower DSO means faster collections and more predictable cash flow.
Days Payable Outstanding (DPO) shows how long you take to pay suppliers. Optimizing DPO helps balance your cash position while maintaining good vendor relationships.
Cash Conversion Cycle combines DSO, inventory turnover, and DPO to show how quickly your business converts investment into cash. A shorter cycle generally means healthier cash flow.
Weekly cash burn rate tracks how much cash your business uses each week, which feeds directly into your runway calculation.
Building a weekly forecast:
Start with your actual opening cash balance from your bank account. Project collections based on invoice aging and payment history. List all fixed payments due that week, including payroll and supplier obligations. Add estimated variable expenses. Compare actual results to your projection at the end of each week and adjust the following week's forecast accordingly.
A consistent weekly review, on the same day each week, is the single habit that separates businesses with strong cash flow visibility from those that get surprised.
Common Mistakes That Derail Cash Flow Forecasts
Overoptimistic revenue projections. Forecasting based on best-case scenarios rather than realistic, data-driven estimates is the most common forecasting error.
Ignoring seasonal variations. Failing to account for predictable fluctuations leads to cash shortages during slower periods that should have been anticipated.
Forgetting one-time expenses. Equipment purchases, annual renewals, and tax payments are easy to overlook in a forecast built around recurring monthly costs.
Infrequent updates. A forecast built once and never revisited loses accuracy quickly. Regular updates based on actual performance are what make a forecast useful over time.
Mixing profit with cash flow. Profitability on your income statement does not guarantee cash in your account. Outstanding invoices and payment timing determine actual liquidity, regardless of what your P&L shows.
Putting It Together
A cash flow forecast is most valuable when it combines all of these elements: a clear view of inflows and outflows, an accurate runway calculation, realistic revenue and expense timing, and consistent weekly tracking of the metrics that matter most to your business.
The goal is not a perfect prediction. It is enough lead time to act. A business that sees a cash shortfall coming eight weeks out has options: accelerate collections, adjust spending, or arrange financing before the gap arrives. A business that does not forecast finds out about the shortfall the week it happens, when the options are far more limited and far more expensive.
If your forecast reveals a gap that operational adjustments cannot close, fast access to capital can bridge it. Trulo Capital can show you what you qualify for in minutes, with funding available in as little as 24 hours.